BDSwiss App
Download & start trading

What moves markets? A fundamental analyst like me will talk about economic fundamentals: inflation rates, growth rates, monetary policy, fiscal policy, unemployment, etc etc. But these are facts. The facts aren’t everything. It’s also important to understand how people interpret the facts. Is the glass half full or half empty? It’s the same glass, but people will interpret it differently depending on their attitude. That interpretation is everything in markets, which arise because people want to buy or to sell.
The seminal event in my career as an analyst was in January 1980. On January 3rd, the Paris Bourse suspended gold trading for the first time in its history because of an order imbalance – buyers only. The next day it had to suspend trading again because of an order imbalance – sellers only. It took 26 years for gold to regain those prices.
It took five years for me to see another day like that. On Feb 26, 1985 the dollar staged its largest single-day advance against major foreign currencies in seven years, rising 4 pfennigs in one day to hit a 13 ½ year high of 3.4390 DEM. The pound hit a record low that morning of $1.03 and change before recovering to end at 1.0615. The odd thing was, nobody could figure out just why the dollar was soaring, but most pundits quoted in the press agreed that it would continue to do so. The next day however then-Fed Chairman Paul Volcker started talking about more FX intervention and in 15 minutes the dollar was down about 8 pfennigs. Spreads were at one time 150 tics.
Events like this taught me that in the final analysis, what makes markets move is not the Fed, not interest rates, not fiscal policy, but two basic human emotions: fear and greed.
The crypto market, where economic fundamentals are secondary in people’s minds if present at all, is a perfect “fear and greed” market. Why do people buy cryptos? Most coins have a story behind them, a theory, an ideology, a mission. People may well believe in these ideas, but at the end of the day they’re buying for one reason: they believe the value of the coin is likely to go up. They are buying it as an investment, an asset. FOMO or Fear of Missing Out is the key phrase here as they see their friends making money and read about Bitcoin billionaires (a feeling I admit I felt too when Bitcoin went to $60k and I began playing around with the question of how much I’d be worth if I had bought $1,000 worth at 5¢ each. Answer: a lot more than I’m currently worth, that’s for sure.)

On the other hand, when prices start to fall some people will be willing to HODL but many others will decide to get out while they still can. Then FOMO is forgotten. Instead we see a market phenomenon that goes by the German word Torschlusspanik: the fear of the closing of a door. This is the panic that fuels bank runs.

That’s what we saw this week. The poster boy for this phenomenon is a coin called Luna. A month ago it was the 4th most popular cryptocurrency. Luna is the sister cryptocurrency of stablecoin TerraUSD, aka UST. TerraUSD is supposed to be pegged at $1, but for some reason it “broke the buck” and is now trading around $0.40. As a result, Luna plunged. It closed at $77.46 on Friday, $64.08 on Sunday, $32.00 on Monday, $17.52 on Tuesday and $1.07 on Wednesday. Thursday while looking for a graph of the price I saw a quote of $0.01491. Oops! Now it’s $0.01289. Down a further 14% in minutes. By comparison, on April 5th it hit a high of $119.18.
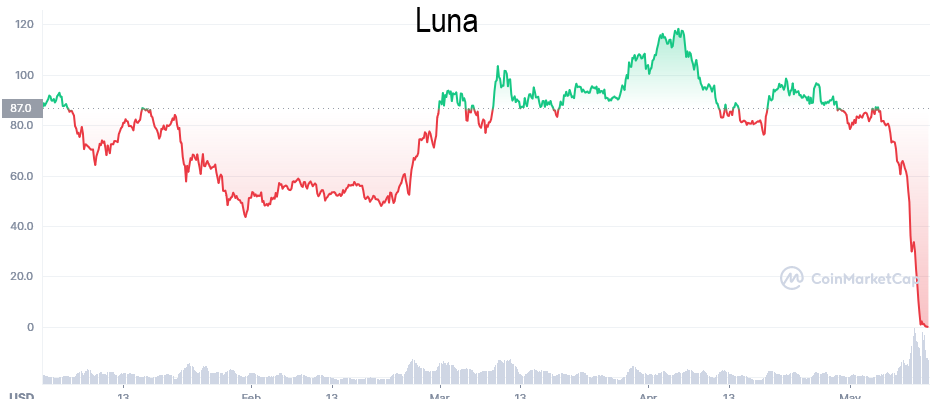
(In case you think it can’t fall any further, Friday morning it was quoted at $0.00005348, down 99.6% from the rate when I was writing on Thursday. In other words, no matter how low it goes you can still lose 100% of your investment in it. Kind of like the financial version of Zeno’s paradox.)
This is a far cry from just this past January, when ads for cryptocurrencies dominated the Super Bowl, the most expensive advertising platform on American TV. “This is a real sort of unveiling moment for the entire sector,” The Wall Street Journal’s reporter said. In what may go down as a masterpiece of unintended irony, he pointed out that the 2022 display of ads from this sector was a lot like “the dot-com Bowl of 2000,” when the Super Bowl ads were dominated by “a slew of internet-related brands, many of which went on to fail.” Hmm…
The odd thing is, a major selling point of these coins was that they are a hedge against inflation because they are not subject to the whims of governments debasing their currencies. On that basis one would imagine that cryptos would now be coming into their own as inflation has risen beyond what anyone imagined a year ago. But it turns out that it doesn’t work this way.
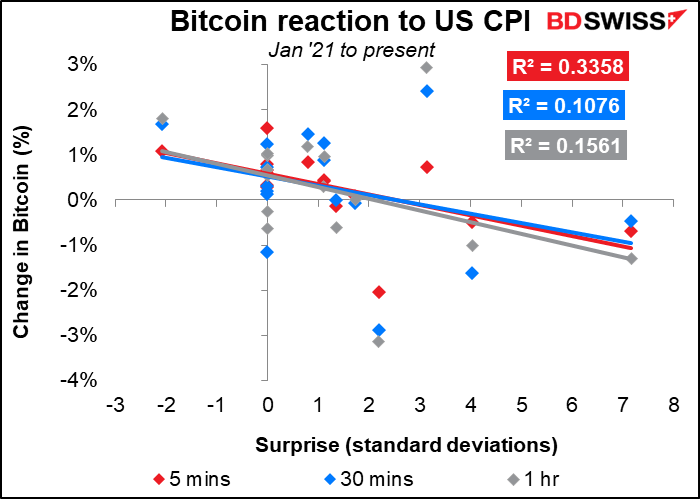
This graph shows Bitcoin and its reaction to the US consumer price index (CPI) announcement. The graph shows how the value of Bitcoin changed 5 minutes, 30 minutes, and 1 hour after the release of the index. The change is measured against the surprise in the announcement – how much the actual release differed from the market consensus forecast ahead of time (measured in standard deviations of the forecasts of the various economists polled). This graph was up to the March CPI, released in April.
What you can tell immediately from the graph is that the trend lines slope downward to the right. That is, Bitcoin tends to fall when the CPI beats estimates and to rise when it misses. If it were really an inflation hedge then the lines would be going in the opposite direction: people would be buying when inflation is spiking. But they’re not. Like holders of any other risky asset, they’re selling when it looks likely that the Fed will raise interest rates further.
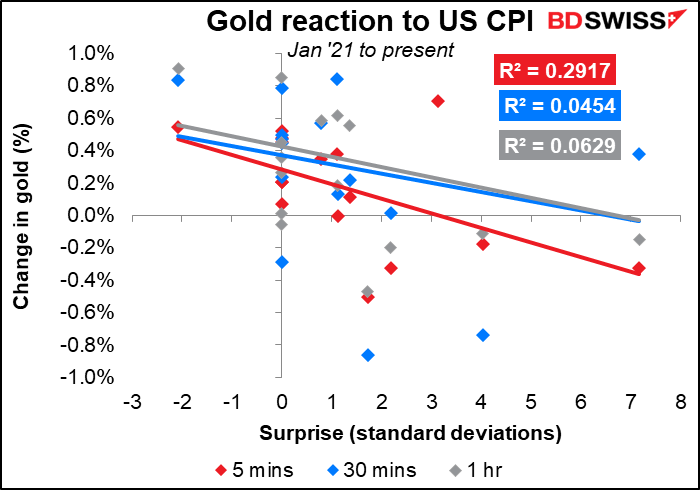
It’s the same with gold, by the way. Gold is also trading like an interest-rate sensitive risky asset, not a hedge against inflation.
Getting back to Bitcoin, this graph is updated with the April CPI figures released Wednesday. You can see that the price of Bitcoin fell much more than it previously would have for a surprise of that magnitude. This suggests increased nervousness among the HODLers.
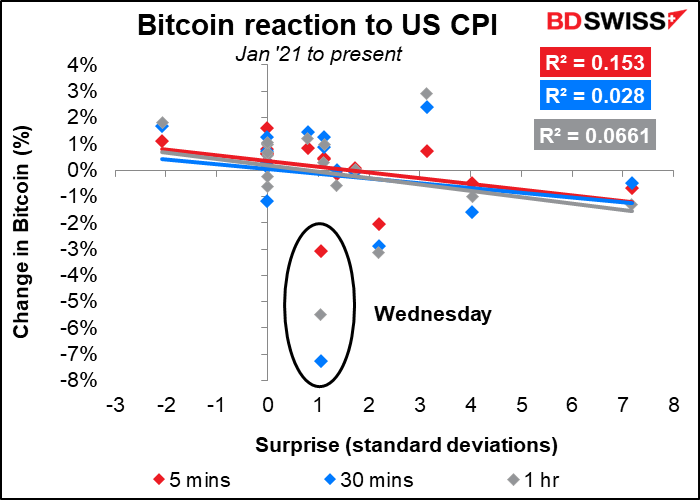
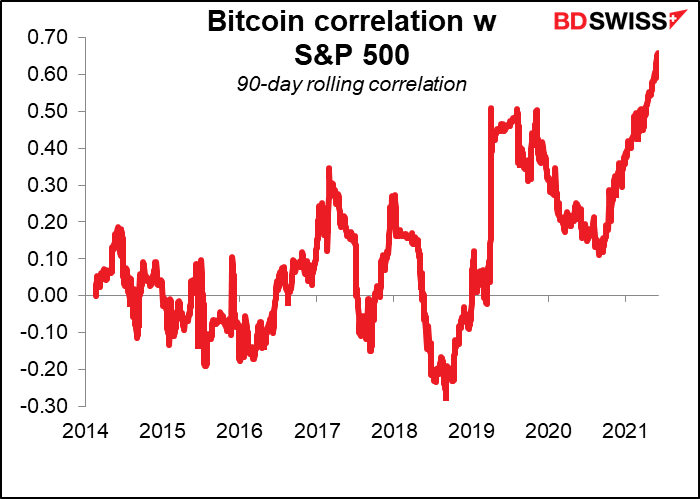
In fact, Bitcoin is now trading almost the same as the S&P 500. The correlation of its daily changes with the stock market has hit a record high of around 70%.
The conclusion here is that the markets are entering a dangerous period due to the psychology of investors. Many traders have never seen a rate hike and never before seen a bear market. People for whom “buy the dip” and HODL worked like a charm for the last 10 years are in the process of learning why companies like ours have a risk warning on our presentations and why we always stress that “past performance is no guarantee of future performance.”
I’m not saying that the market is inevitably headed lower. Many people thought cryptos were finished when Bitcoin fell from its December 2017 high of $19,042 down to $3,157 a year later. But look what happened! Indeed on Thursday Bitcoin was down 10% on the day at one point but bounced back by some 20% to trade up 7% from Wednesday’s close. Just remember though while you’re trading that markets can go down as well as up. This is a lesson that many people who started trading in the last 10 years have yet to learn.
Indicators next week: more CPIs, UK in the spotlight.
As usual, the focus next week will be on the inflation data. Britain and Canada release their CPIs on Wednesday, Japan releases its national CPI on Friday.
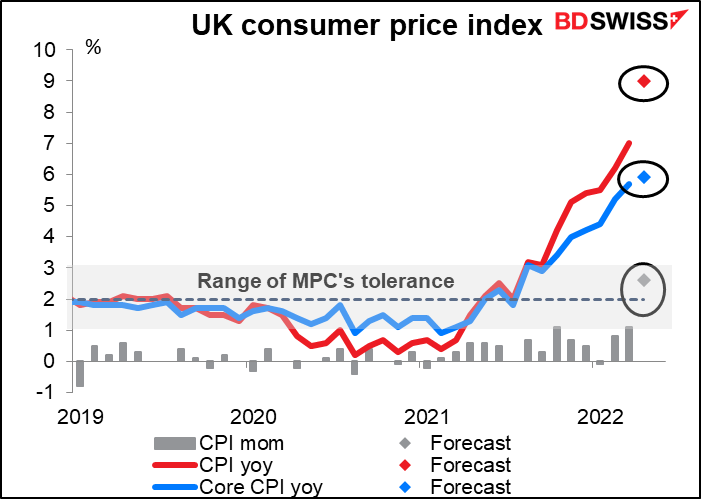
Britain’s inflation is expected to soar as the price cap on household energy jumped 54% in April. The headline figure shouldn’t shock anyone as the Bank of England forecast inflation would be around 9.1% yoy in Q1. Still, even core inflation excluding energy is forecast to rise, too. Coming after this week’s disappointing GDP figures, which should that output fell in March, the CPI will illuminate the Bank of England’s dilemma: an acute inflation vs growth trade-off. I suspect they will opt for growth. That implies lower real interest rates and a weaker pound.
The UK has several other major indicators coming out this week, namely employment (Tue) and retail sales (Fri). But attention is likely to be focused on the growing dispute over the Northern Ireland (NI) protocol. Like a zombie that refuses to die, this issue just keeps coming back from the grave over and over again – probably because no good solution was possible to begin with. European Commission (EC) Vice President Maroš Šefčovič and British Foreign Secretary Liz Truss have exchanged sharp words recently on the subject.
According to The Economist, the problem is that the Democratic Unionist Party (DUP), which came second in the recent NI election, dislikes the protocol for undermining NI’s ties with “the mainland.” It is refusing to take up its post as deputy first minister in the NI Executive (the office that runs the NI devolved government) until the protocol is scrapped or radically altered. (The Executive can’t function without both a first minister and deputy first minister, so their refusal shuts down the NI government.) In response Truss reportedly plans to put forward a new bill to ditch most of the protocol, which of course the EC wouldn’t like at all. Such a move would probably invite lawsuits and trade retaliation, which would be negative for the pound.
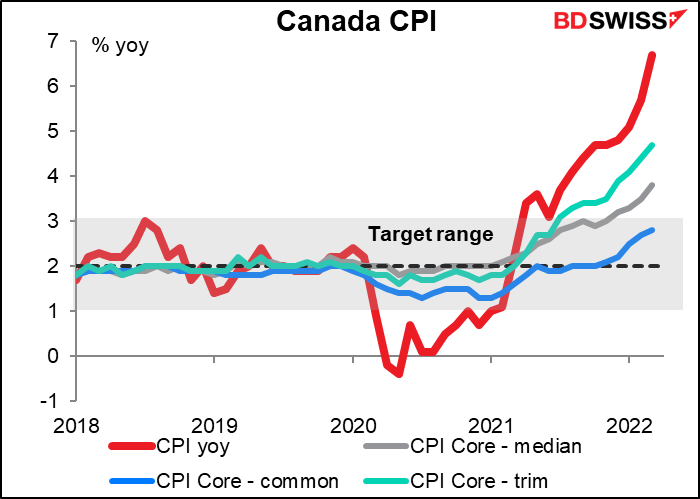
There are no forecasts available yet for Canada’s CPI. A higher number would be no surprise. In the statement following its April meeting, the Bank said, “CPI inflation is now expected to average almost 6% in the first half of 2022 and remain well above the control range throughout this year.” The figure is likely to set up a hawkish background to the Bank of Canada’s meeting on June 1st. CAD+
Canada also releases its housing starts number on Monday.
Japan’s national CPI is expected to leap 1.3 percentage points to 2.5% yoy. This would be the first time in decades that it’s been above 2% without a hike in the consumption tax (almost). Can we expect fireworks in Kasumigaseki, the area of Tokyo where the Bank of Japan is located? Hardly.
The Summary of Opinions from the April Bank of Japan meeting showed that most members of the Monetary Policy Board remain skeptical about whether inflation will remain sustainably above their 2% target. “The year-on-year rate of change in the CPI is likely to be at around 2 percent for the time being from April, but a rate of increase that exceeds 2 percent is unlikely to be sustained given the household budget constraints,” one member said. Another opined that “The year-on-year rate of change in the CPI is likely to be at around 2 percent in the first half of fiscal 2022, due mainly to a surge in commodity prices. From the second half, however, attention needs to be paid to downside risks brought about by possible declines in commodity prices.” Still worried about the downside risks to inflation!
Note too that the “core-core” rate of inflation, excluding energy and fresh foods (not shown), which is analogous to core inflation in other countries, is expected to be up only +0.7% yoy. This is a big turnaround from deflation of -0.7% yoy in March but still it’s hardly the kind of rise that’s causing panic in central banks in other countries. JPY neutral

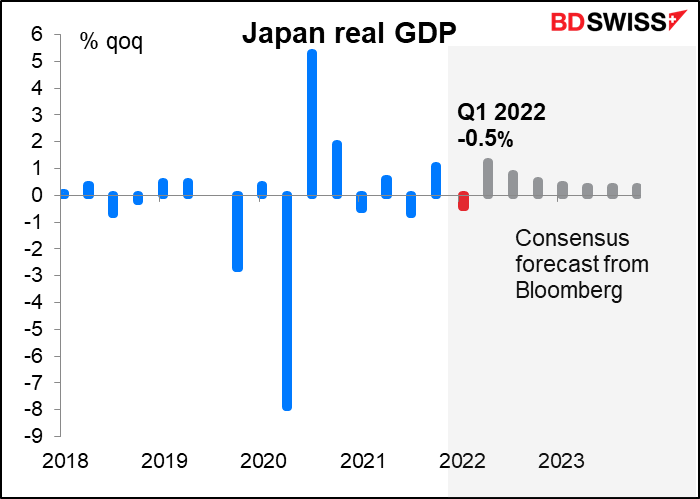
Japan also announces its Q1 GDP on Wednesday. The market is expecting a fall in output, probably due to lingering COVID-19 restrictions and problems with the supply chain from China. Growth is expected to rebound in Q2 so I don’t expect this to have a lasting impact on the yen. Nonetheless it’s yet another reason for the Bank of Japan to hold off normalizing policy or even just tinkering with the ±25 bps rate cap in their “yield curve control” policy. JPY-negative
There are other important Japanese indicators coming out as well, such as tertiary sector (Tue) and trade balance and machinery orders (Thu).
For the US, the big day will be Tuesday, when retail sales and industrial production will be released. Retail sales are expected to be up a bit in line with the six-month moving average (+0.9% mom vs +1.0% mom average), which may reassure people that the US consumer remains healthy and in a buying mood. The figure was likely boosted by an 8.9% mom increase in auto sales. Excluding autos and gasoline station sales, it’s expected to be up a more modest 0.4% mom.
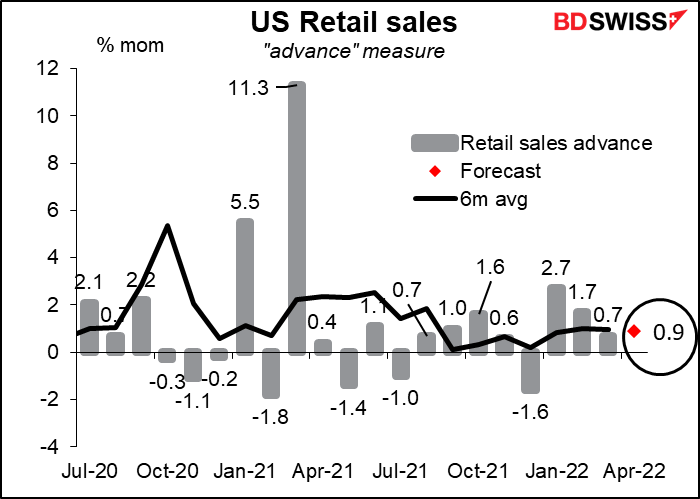
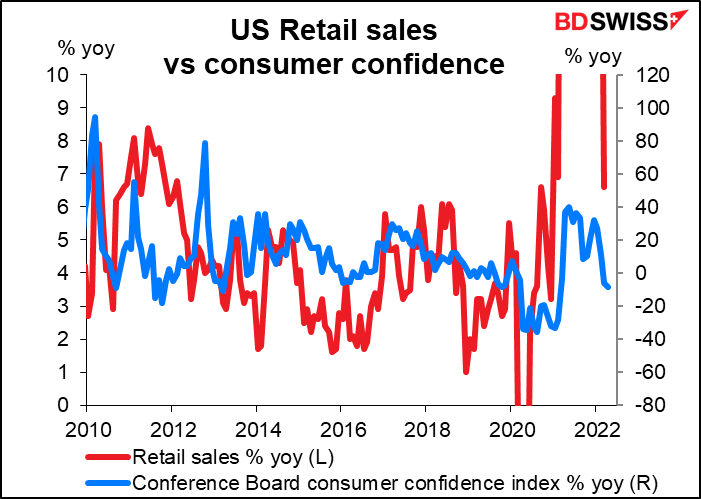
Still that’s pretty good given the recent plunge in consumer confidence, although as I’ve said before, I don’t see much evidence that consumer confidence surveys provide a useful forecast for consumption. I think the data will reassure people about the health of the consumption-led US economy and therefore be positive for USD.
The US also will see the Empire State manufacturing index (Mon) and the Philadelphia Fed business sentiment index (Thu), as well as two housing-related statistics: housing starts (Wed) and existing home sales (Thu). The housing data will be particularly important in light of the recent rise in mortgage rates and anecdotal evidence of a pullback in demand for houses as stocks fall and the reverse wealth effect goes into action.
Both series are expected to decline only modestly: starts 1.76mn annual pace vs 1.79mn previous, sales 5.65mn annual pace vs 5.77mn. The resilience of the housing sector in the face of higher interest rates may reassure the Fed that they can keep on hiking rates without tanking the US economy. That’s going to be bullish USD but bearish equities maybe.

Not much on the schedule from Europe: 2nd estimate of Q1 GDP (which is rarely revised more than ±10 bps) and German producer prices and EU consumer confidence on Friday.
Two major Australian indicators come out during the week: the 1Q wage price index (Wed) and employment (Thu). Up to the April meeting, the Reserve Bank of Australia (RBA) had argued that it couldn’t raise rates because “growth in labour costs has been below rates that are likely to be consistent with inflation being sustainably at target.” This of course changed at the May meeting, when they said “The Bank’s business liaison suggests that wages growth has been picking up” and they went ahead and hiked by 25 bps. Now we have to see if the data back up what they’re hearing.
The market forecasts suggest that the RBA is on the right track. Wages are expected to rise 2.4% yoy, up from 2.3% yoy in Q4 last year and a low of 1.4% yoy in Q3 and Q4 2020.
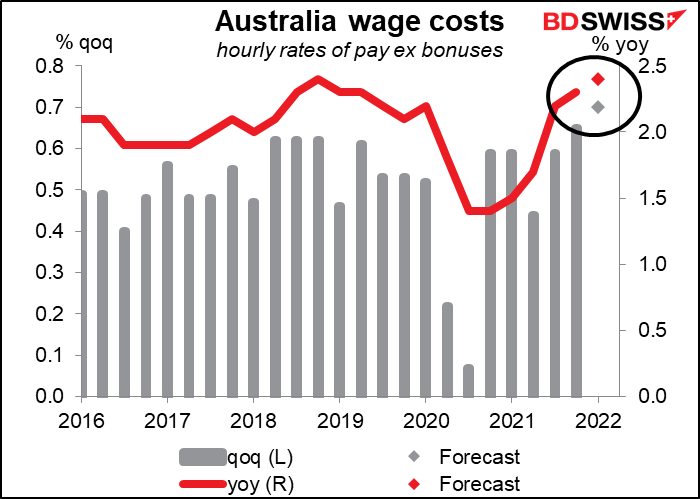
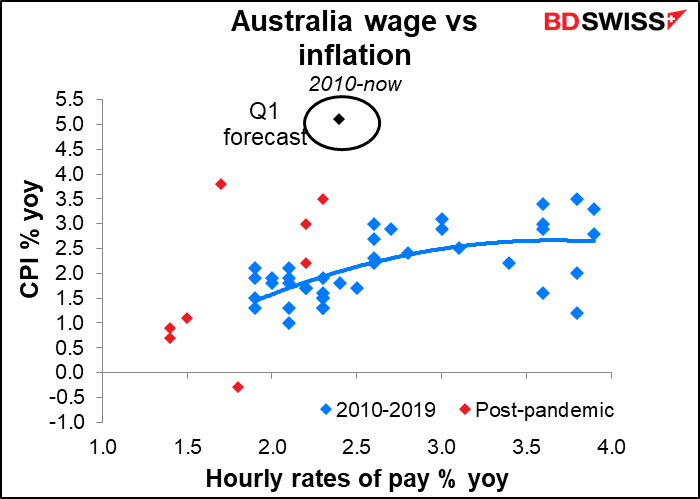
Historically this is a level of wage increases that has been associated with inflation of around 2% so at least at the bottom of the RBA’s 2%-3% target range. In any case, the direction accords with what they want to see. This index is released quarterly so this week’s edition is the only one they’ll have before the June, July, and August RBA meetings. AUD+
 Marshall Gittler
Posted on 23 April, 2024 at 12:32 GMT
Posted on 15 April, 2024 at 17:19 GMT
Posted on 08 April, 2024 at 16:57 GMT