BDSwiss App
Download & start trading

Previous Trading Day’s Events (25.03.2024)
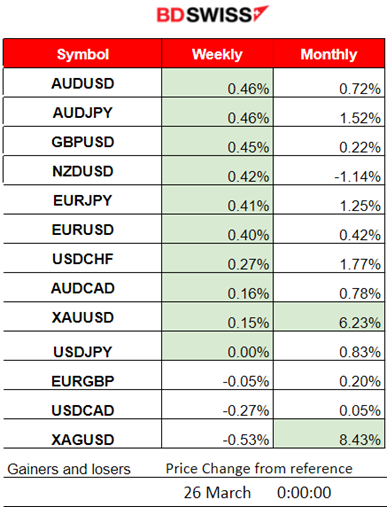
Winners vs Losers
AUDUSD reaches the top of the winner’s list with 0.46% followed by AUDJPY. It is clear from the charts that the USD and JPY have recently depreciated against the AUD a lot, reversing the post-FOMC effect.
 ______________________________________________________________________
News Reports Monitor – Previous Trading Day (25 Mar 2024)
Server Time / Timezone EEST (UTC+02:00)
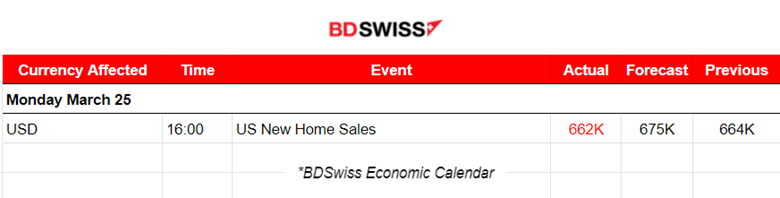
No important news announcements, no special scheduled releases.
No important news announcements, no special scheduled releases.
General Verdict:
 __________________________________________________________________
FOREX MARKETS MONITOR
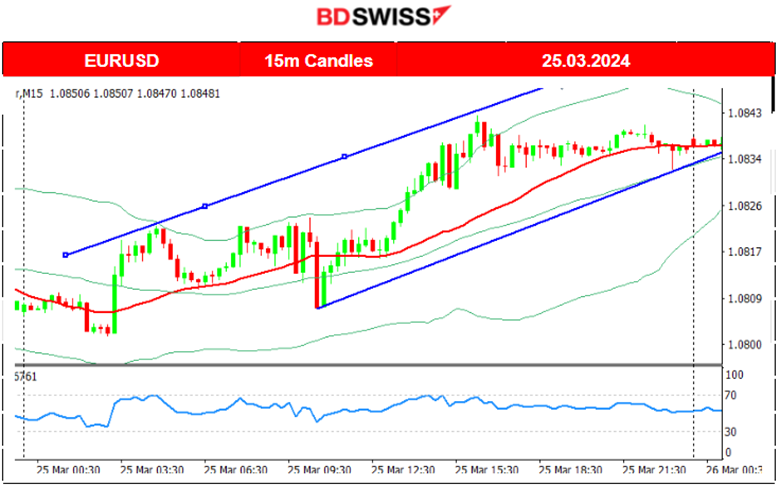
EURUSD (25.03.2024) 15m Chart Summary
Server Time / Timezone EEST (UTC+02:00)
Price Movement
The pair moved to the upside overall as the dollar continued with depreciation. Since the FOMC, the initial reaction was for the EURUSD to jump high at 1.09430 and then continued with a steady drop as the dollar was experiencing unusual and long appreciation. The pair eventually reached the support near 1.080 and retracement followed with the dollar on the 25th of March to depreciate causing the pair to move steadily upwards this time.
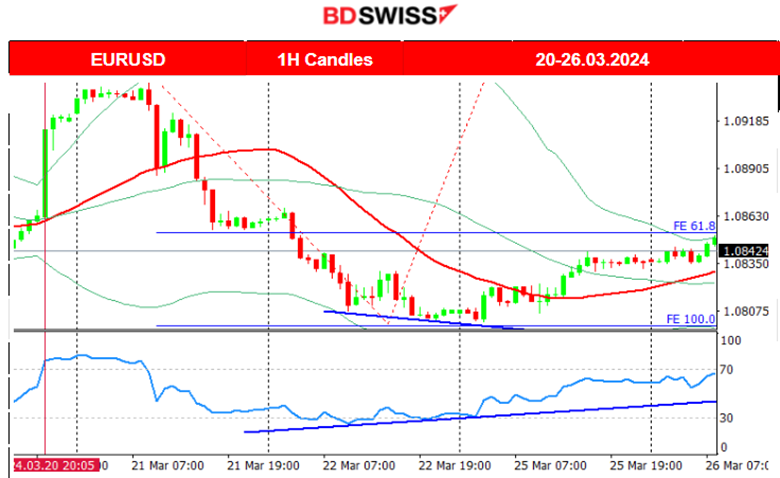
 EURUSD (25.03.2024) 1H Chart Summary
Server Time / Timezone EEST (UTC+02:00)
Price Movement
H1 Chart Technicals: Fibo retracement to 61.8 plus a bullish divergence completion all in one chart since the FOMC event that took place on the 20th of March.
 ___________________________________________________________________
CRYPTO MARKETS MONITOR
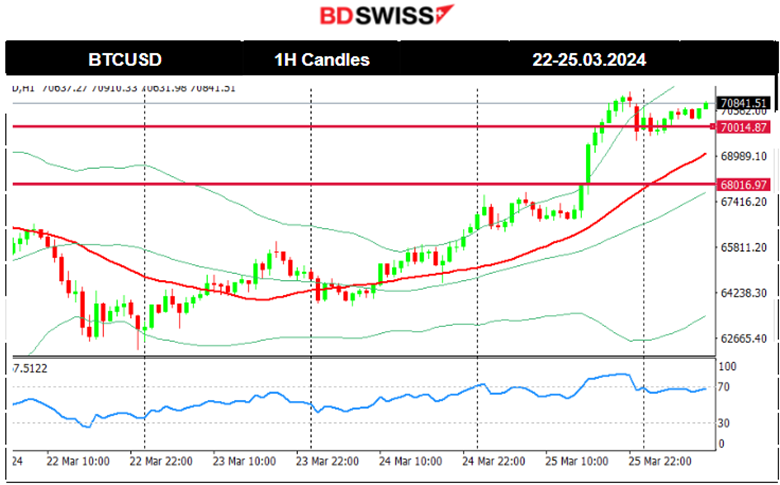
BTCUSD (Bitcoin) Chart Summary 1H
Server Time / Timezone EEST (UTC+02:00)
Price Movement
Bitcoin suffered losses recently dropping from the peak at 74K, and continuing downwards until the FOMC event. After the news and during the press conference, Bitcoin saw a rise, returning back to the mean.
The 10 US spot bitcoin ETFs collectively saw net outflows each day last week and those net outflows slowed later in the week.
Since the 22nd of March, it actually experienced a good comeback with the price moving upwards crossing the 30-period MA on its way up and showing upward momentum.
The 68K USD level resistance was breached on the 25th of March and the price moved higher even beyond 70K USD. Bitcoin launches another take-off probably. at least until 83K USD.
Caution is advised for short-term traders regarding the resistance at 74K USD.
Related article:
https://www.coindesk.com/markets/2024/03/25/bitcoin-pumps-above-69k-as-crypto-rally-resumes/
 Crypto sorted by Highest Market Cap:
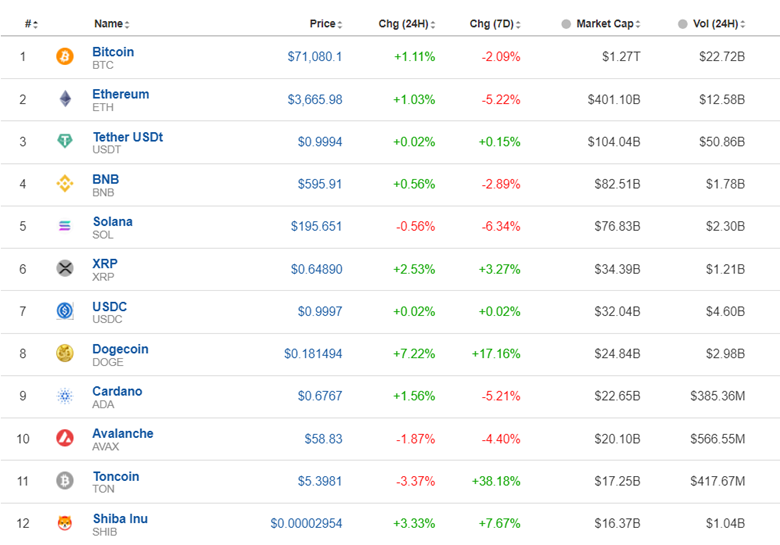
Crypto assets could see further corrections and even higher performance as the halving event is near. However, more inflows should be in place for this to happen. Currently, we do not see any significant inflows.
Source: https://www.investing.com/crypto/currencies
______________________________________________________________________
EQUITY MARKETS MONITOR
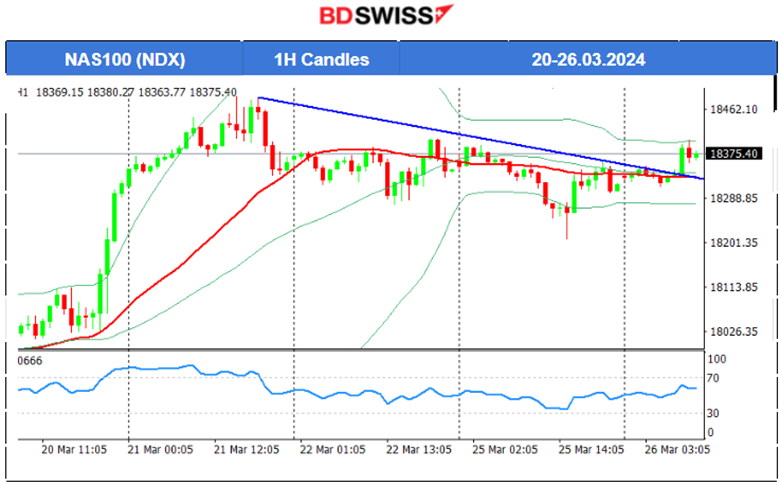
NAS100 (NDX) 4-Day Chart Summary
Server Time / Timezone EEST (UTC+02:00)
Price Movement
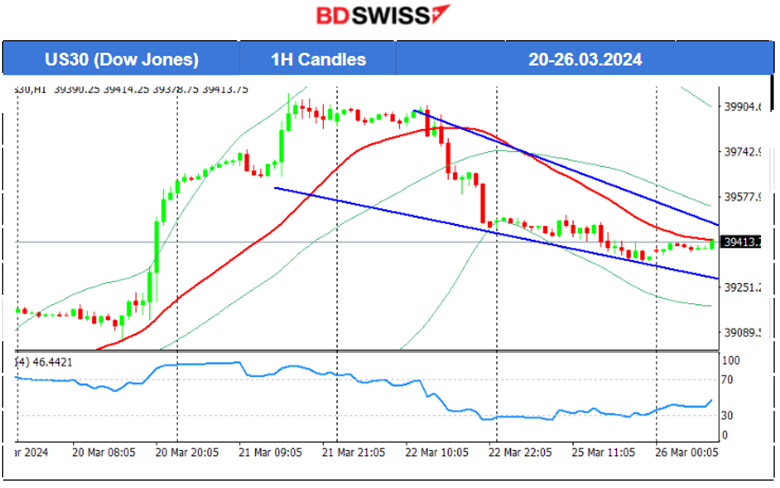
After the FOMC event on the 20th of March, all U.S. indices saw a jump. The market’s initial expectation was that borrowing costs would lower soon or as expected this year, sparking this upward movement and resilience to the downside. Soon, however, expectations changed. The dollar saw massive strengthening and the U.S. indices started to drop since the 21st March. The Dow Jones fell rapidly from the 21st March’s peak near 40,000 down to 39,500 USD. Indices currently remain sideways, around a slightly falling 30-period MA except the Dow Jones (US30) sees a clear heavy downfall.
 US30 (Dow Jones) 4-Day Chart
Server Time / Timezone EEST (UTC+02:00)
 ______________________________________________________________________
COMMODITIES MARKETS MONITOR
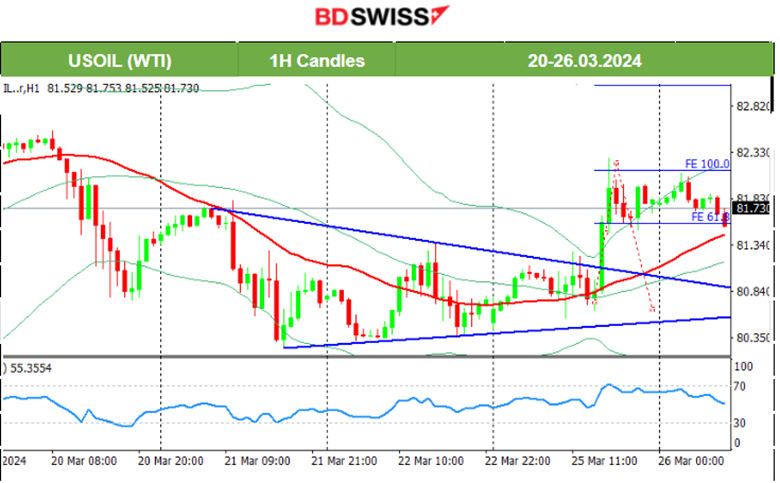
USOIL (WTI) 4-Day Chart Summary
Server Time / Timezone EEST (UTC+02:00)
Price Movement
Crude oil found a peak at 83 USD/b on the 19th of March and then retraced to near 80 USD/b following the FOMC. As mentioned in our previous analysis, the price eventually moved above the 30-period MA on the 25th of March. The bullish divergence is completed and at the same time, a triangle formation is breached as depicted on the chart. Crude oil moved to 82.3 USD/b before retracement followed.
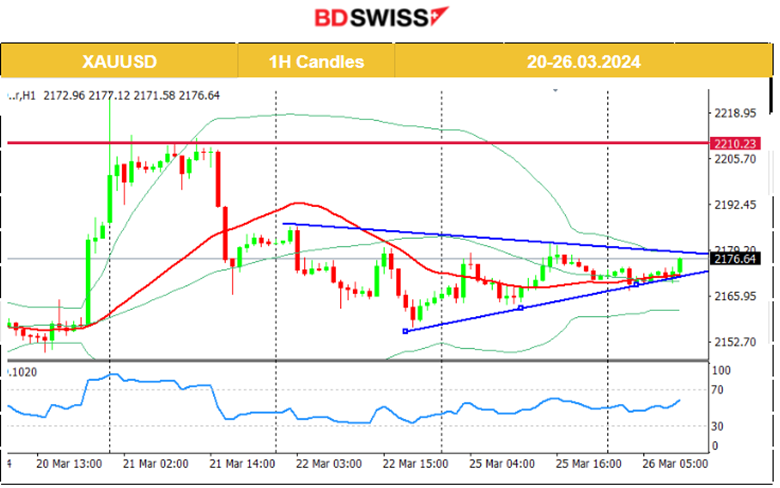
 XAUUSD (Gold) 4-Day Chart Summary
Server Time / Timezone EEST (UTC+02:00)
Price Movement
FOMC: Powell decided yesterday to ignore the inflation data and their statements gave even a hint that rate cuts will proceed as expected. Gold Jumped near 65 USD as the USD depreciated heavily during the press conference. The dollar showed unusual strength after the FOMC event causing Gold to wipe out the gains since the FOMC news. Since the 21st of March Gold moved below the 30-period MA and remained on a downtrend until the 25th of March where it settled near the mean at 2170 USD/oz. Now it shows signals of a potential upward movement, breaking an apparent triangle formation that could cause the price to return back to the high-level resistance at near 2210 USD/oz.
 ______________________________________________________________
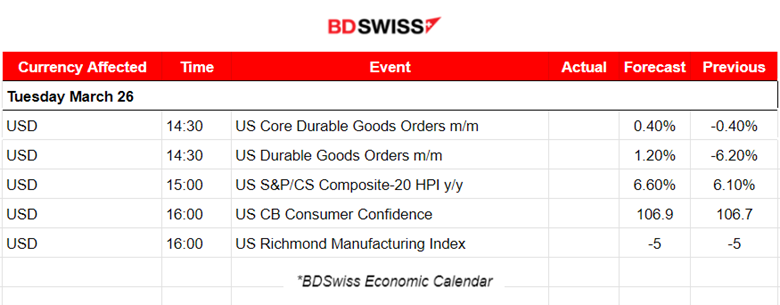
News Reports Monitor – Today Trading Day (26 Mar 2024)
Server Time / Timezone EEST (UTC+02:00)
No important news announcements, no special scheduled releases.
The U.S. durable goods figures will be released at 14:30 and the changes in durable goods orders are expected to increase. This is consistent with retail sales figures in the U.S. and strong PMIs that reflect business growth. USD pairs could be affected greatly by USD appreciation during that time.
The CB consumer confidence at 16:00 will shed some light in regards to what American consumers have in mind after the FOMC statements and if their purchasing decisions are going to change dramatically. Not to forget that the Fed’s projections for inflation are in favour of a substantial decrease.
Regarding the decline in February: “The decline in consumer confidence in February interrupted a three-month rise, reflecting persistent uncertainty about the US economy,” said Dana Peterson, Chief Economist at The Conference Board. “
General Verdict:
______________________________________________________________
 Marios Kyriakou
Posted on 26 April, 2024 at 14:04 GMT
Posted on 25 April, 2024 at 15:14 GMT
Posted on 24 April, 2024 at 15:53 GMT
Posted on 23 April, 2024 at 11:46 GMT
Posted on 22 April, 2024 at 14:46 GMT